
Introduction
One of the stories most mocked in the Bible is the story of Noah’s flood. In the story, God decides to flood the entire earth and save only his chosen servant, Noah, and his family. God did this because nearly all of mankind had gone astray into wickedness, thus requiring what one might call a great reset.
Atheists and skeptics of course mock the story because of its many elements that seem physically impossible. On the other hand, apologists often try to minimize the story by claiming it is a local flood and then pointing at various regions of the world that we know were flooded in history. In the author’s opinion, this isn’t really necessary, as the text never claimed that the flood story was following the laws of physics, but instead portrayed the flood as a miracle or an act of God. Methinks the truest reading of the text (Genesis 6 – 8) is that there was literally a global flood. Thus, the object of this research is to evaluate the global flood mythology across various cultures and tribes.
To jump straight to the conclusion, here I show that:
- Flood stories from the eastern United States are far more similar to the biblical account than from other world regions, and this is statistically significant.
- The Biblical account of the flood is missing two important features: A) that Noah was prevented from working prior to the flood, and B) that one of the birds he sent out disobeyed him by getting distracted by eating dead meat and thus was cursed by God to turn into a vulture. These two elements are very frequently found in apocryphal variations of the Bible, the middle east generally, and again in North America.
- Flood stories from Africa, Australia, New Guinea, and Brazil are far less similar to the Bible than ones from North America, Europe, and Asia. This difference is again statistically significant.
Data Acquisition
The underlying data of this research comes from a survey that I ran with a large language model on 375 accounts of the flood scraped from this website. Thus, much credit for all of this is due to the painstaking diligence of the authors of that site in collecting and organizing flood stories from all across the world. And to note: I believe this site is fairly unbiased, seeing that it actually has several anti-Christian, pro-atheist essays on its home page.
After scraping all of the stories, I then ran fed each story through the AI model llama3.1:8b. The model was given the text of the story, as well as a battery of 105 questions for it to score on a scale from 0 to 1, thus providing a 105 element long vector representing attributes for each story. For good measure, I actually ran all of this 12 times and so the attributes of the story that I end up using are the averages across each attempt.
Here are all of the fields that I measured:
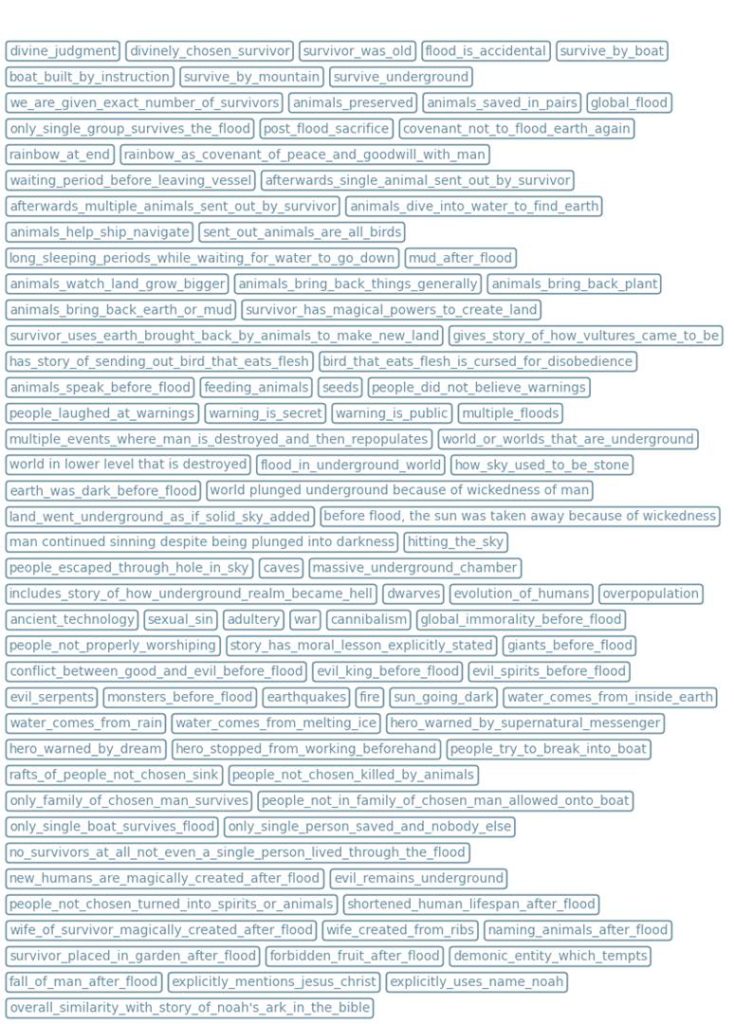
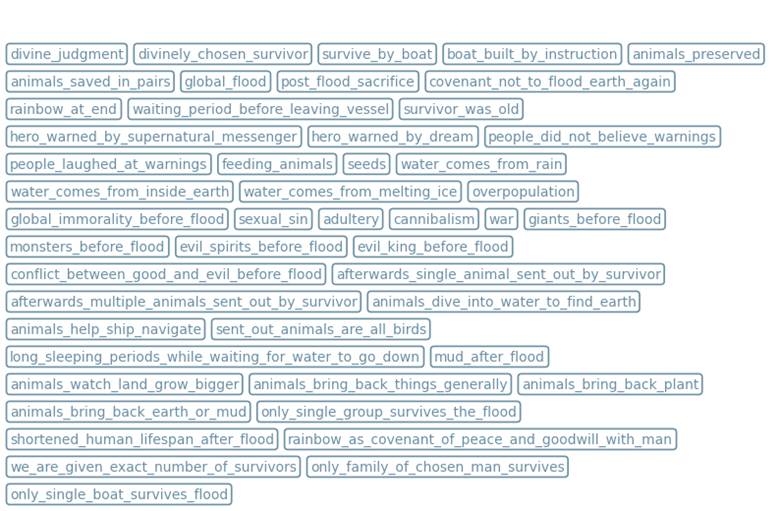
Since many of these fields didn’t really relate to the Biblical account, I actually only used 49 of these fields to estimate a story’s similarity to the Genesis account [the other fields were for a separate analysis I am still working on relating to underground floods]. These are the 49 variables I used:
Importantly, each flood story was classified as being part of a broader region. Here are the regions:
World Regions
- Europe
- Middle East
- Africa
- Northern Asia
- Central Asia
- East Asia
- Malaysia, Indonesia, & Philippines
- Australia
- New Guinea
- Pacific
North America
- Arctic
- Subarctic
- Northeast
- Northwest Coast
- Plateau – eastern Oregon, to Idaho, to the Canadian Rockies.
- Plains
- Southeast – southern half of the eastern USA
- California
- Great Basin – Utah and Nevada
- Southwest – northern Mexico, Arizona, New Mexico
- Mesoamerica
- Caribbean
South America
- North – around Colombia
- Andes
- Amazon
- Eastern Brazil
- Gran Chaco – around Northern Argentina and Paraguay
- Far South
The last “region” classification given by the website was called Noachian Variations. As far as I can tell, stories usually are classified this way because they are either 1) apocryphal accounts of Biblical Noah; 2) elaborations of Biblical Noah’s story in various cultures; 3) tribal stories across the world that are clearly influenced by the Bible and missionaries (for example, they use the name Jesus or Noah); 4) random places that the author of the website somewhat arbitrarily decided to classify as a Noachian variation, even though they might just be the native’s actual legends and were not inspired by the Bible at all (like this one).
I also filtered out the following accounts from my analysis because they were partially corrupted by Christianity (bringing the total number of analyzed places down from 375 to 368): popoluca, mayaYuc, yaqui, chaldean, zapotec, islam, tanzania. These are places which the author of the website concluded were likely influenced by Christian missionaries, but still didn’t classify as Noachian Variations because the region had multiple stories and the other stories weren’t from Christianity, or because these stories were amalgamations of tribal accounts and Christian teachings. I suppose I could have just cut out the Christian parts of these stories and kept them, but to simplify the analysis I just excluded all stories from these places.
Estimating the Similarity of Flood Stories to the Genesis Account
The core question analyzed in all of this research is whether certain regions of the world have flood stories that are far more close to the Bible than other regions. Hence, I have several analyses here which measure the average similarity of flood stories to the Bible across regions.
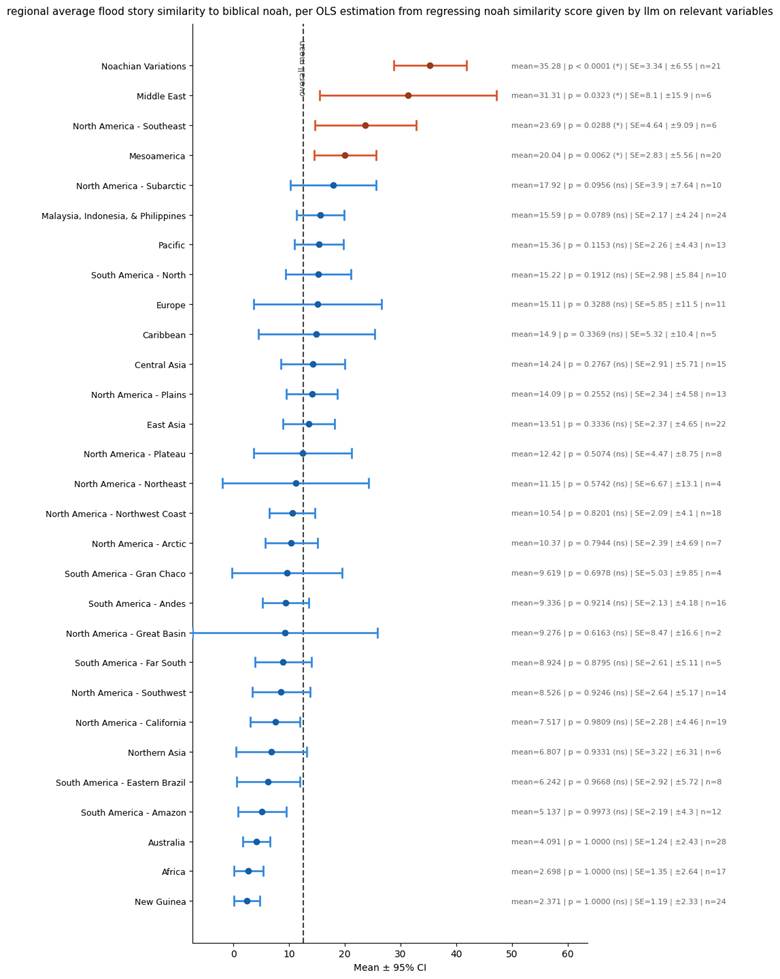
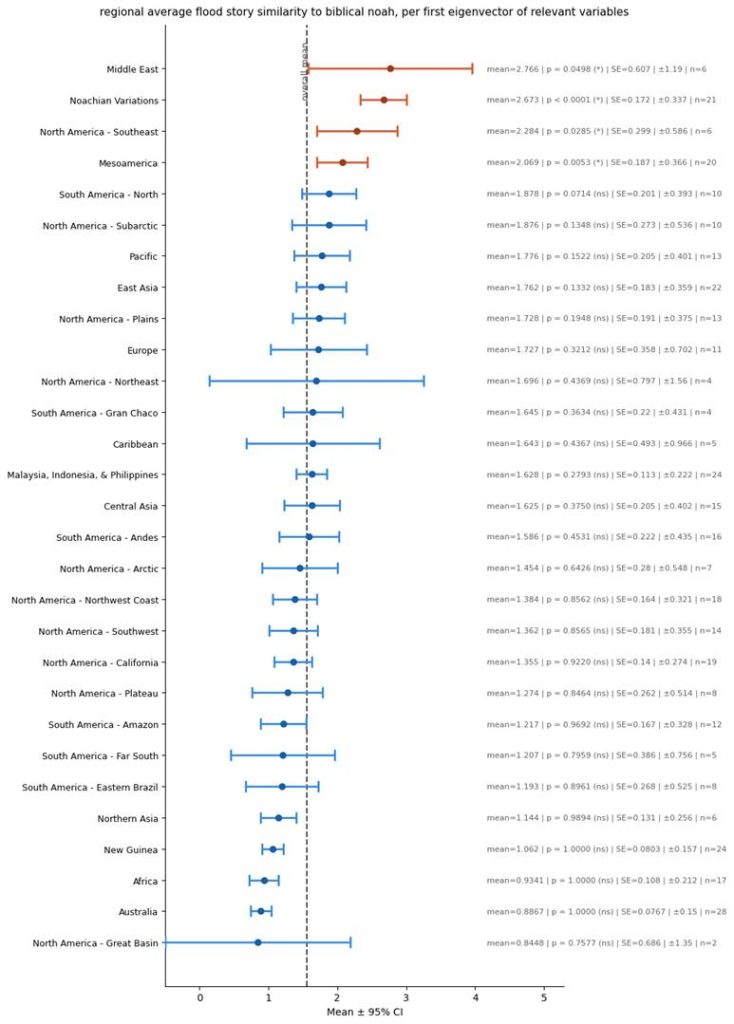
You will notice that average similarity scores I give to each region include confidence intervals and p values. The idea behind this is that since my dataset is not truly comprehensive, I therefore cannot have total certainty of what the average similarity stories from that region have to the Bible. All I can do is provide a range of where I believe the mean similarity score is. Thus, the confidence intervals I provide for each region show the range of averages for which I have 95% confidence that the true mean is within.
I also provide a p value for each region: This p value represents the chances that said region does not actually have a mean similarity score which is above the world average (so 1 sided). Basically, if a region has a high similarity score, but also a high p value, that means that there was a lot of variance in the stories from that region, and so it is difficult to draw conclusions on what the true average is for that region. Conversely, if a region has a low p value, that means that I have enough stories from the region with a low enough variance amongst them to be confident that the region does indeed have a higher average similarity score than the global average.
Also, if you can’t read the small text, the grey line going through the center of each plot depicts the global average similarity score.
As Rated By LLM
The simplest way I estimated whether a region’s story is similar to the account of Noah in the Bible is simply by asking the LLM to score the story on a scale of 0 to 100 on this similarity. This diagram shows the results from such scorings, aggregated by regions.
Regressing the LLM’s Similarity Score on all columns to create a Predicted Similarity Score
Because of the possibility that LLMs are kind of biased and influenced by trivial things, I also estimated the similarity of each story to the Biblical Noah account using the 49 columns collected relating to this story.
The problem then was how to properly weigh each of these columns to provide a final similarity score. I solved this by using all of the 49 columns in an OLS regression to predict what the LLM’s score for the story’s similarity would be. This regression therefore gave me parameters (or slopes) for each column which weighed how important the column should be in predicting the similarity score from the LLM.
Thus, using these parameters from the regression as weights for the importance of each column, I was able to obtain a new estimate for the similarity score of each flood story to the Bible. Here is a plot of the regional averages for these scores:
Using Eigenvectors to predict similarity to Bible score
Another common technique used in statistics to aggregate many variables into one variable is the use of Eigenvectors.
The philosophy of Eigenvectors is that if many variables are correlated with each other, then potentially a single variable will be able to explain much of the variance across all of these other variables. A good example of this philosophy is the idea of general intelligence. If general intelligence exists, then you would expect that if you employed a diverse battery of intelligence tests against people – such as testing them on math, short term memory, logic, spatial awareness, pattern recognition, language processing, reaction time, etc. – then people’s intelligences in each field should be correlated with each other field. Thus, for example, a person’s mathematical intelligence should be correlated with their language processing, reaction time, memory, and everything else. In other words, there is a single hidden factor – general intelligence – for each person which explains their performance in all these diverse tests.
Extending this theory to the problem at hand, theoretically there is a single factor which predicts all 49 of the relevant features from each story – of which factor may be a proxy for how similar that story is to the Biblical account. The conventional way to estimate this single factor is known as the first Eigenvector (or also called the first principal component). Basically, the first Eigenvector is computed to be a column of data in the perfect configuration to have the highest correlation squared with the many columns provided to create this Eigenvector.
So, if I use the eigenvector of all 49 columns as a proxy for the similarity of stories with the Bible, then I get this result:
Robust Eigenvector
The potential problem with Eigenvectors is that they are susceptible to being distorted by imbalanced columns. On one hand, if several columns are highly correlated with each other, then Eigenvectors will be overly biased towards producing values like these columns – as this is an easy way for them to increase their net correlation squared with all the columns. On the other hand, if some columns are pretty much random and not correlated with the general factor, the Eigenvector will still slightly weigh in those columns – again to increase net correlation squared (when those columns actually should have received zero weight). Therefore, here I have developed a new estimator for the elusive common factor which should be more robust against imbalanced columns.
So here is how my robust-Eigenvector estimator is different: Instead of trying to pick values which maximize net correlation squared across all columns, my robust estimator instead picks values to maximize the net correlation squared with the specific column that is in the 80th percentile with the lowest correlation squared with itself.
This is calculated using gradient descent. Specifically, the computer starts off assuming that the robust Eigenvector is just the average of all of the columns. Then it finds which column is in the 80th percentile with the lowest correlation squared with it, and it figures out how much each of the values in its robust Eigenvector estimation needs to move so that its correlation squared with this 80th percentile column increases. After slightly moving towards this 80th percentile column (or away from that column if the correlation is negative), it then recalculates what the new 80th percentile column is, and it repeats the step of slightly moving itself so that its correlation squared with this new 80th percentile column increases. After repeating this process a few thousand times, it eventually reaches an optimal state where moving any of the values to optimize correlation squared with the 80th percentile column doesn’t help, since it only leads to a new column becoming the 80th percentile, of which new column is no better.
The reason why this is more robust is because: if there are several columns tightly correlated with each other, these won’t bias the estimation excessively because once the estimation gets close enough to these columns that they no longer are around the 80th percentile, then these columns can longer further influence the result. On the other hand, for columns that should never have been included because they aren’t associated with the common factor, they won’t mess up the estimation as long as they comprise less than 20% of the total number of columns – as the estimator doesn’t care about the 20% of columns which are least correlated with the common factor.
The final result is that this robust estimator will try to get as close as possible to the best most easily predicted 80% of columns, and the other 20% of columns which are more random it won’t care about at all. For those 80% of columns, it will have a “no-child-left-behind” approach, trying to make the worst column as close to it as possible, rather than overly focusing on getting close to elite clusters of columns.
To test if this robust estimator actually works, I created a simulation in which I created a column for the general factor (called g) and added additional columns which would be correlated with this g. I then exposed various estimators of g to these additional columns to see which estimator got the closest to g, even in complex situations.
Specifically, for this test, I created 6 columns which were independent of each other but had a 44.8% correlation with g. To confuse the estimator, I added an additional 10 columns which only had a .05% correlation with g but had 99% correlation with each other – the goal being to see if these columns tricked the estimator into missing the general factor and only estimating this specific cluster of columns. And finally, I also added 4 irrelevant columns which had no correlation with g at all. Thus, the breakdown was: 10 columns highly correlated with each other, 6 independent columns which have a strong correlation with g, and 4 columns which were totally irrelevant. Here is a breakdown of how well each estimate of g was:
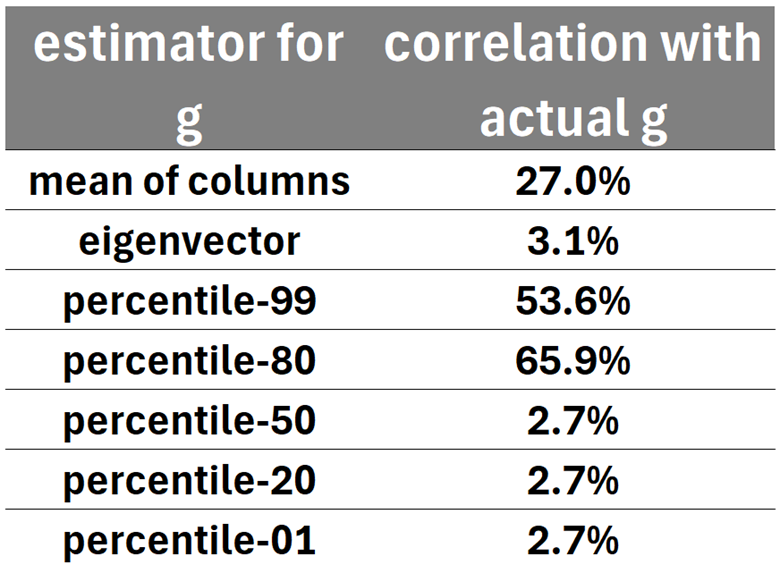
* in this graph, “percentile” stands for my robust Eigenvector estimator using different percentiles of columns to prioritize.
As you can see, the 10 highly correlated columns completely tricked the naïve Eigenvector estimation, thus leading to the Eigenvector performing far worse than even the simplest estimator – namely, that of taking the mean of all of the columns.
Regarding my robust estimators, when told to estimate the 80th percentile least correlated column or the 99th percentile least correlated column, both avenues performed pretty well – though the 99th percentile one was slightly worse, as it was distracted by the 4 columns which were totally irrelevant, while the 80th percentile one didn’t care about those columns and so did better. Unsurprisingly, my robust estimator failed when the percentile was 50% or lower, because since 50% of the columns were all highly correlated with each other, it instead started purely copying those highly correlated columns and not anything else.
I don’t know how many people will understand what I just said here, but basically:
this robust Eigenvector estimator I will use here is less likely to get confused if I have several columns that are highly correlated with each other. To note: this robust estimator won’t always do better – in an ideal world in which the columns are balanced properly, a simple Eigenvector estimation will probably do better than this robust estimator. Rather, this robust Eigenvector serves more as a sanity check.
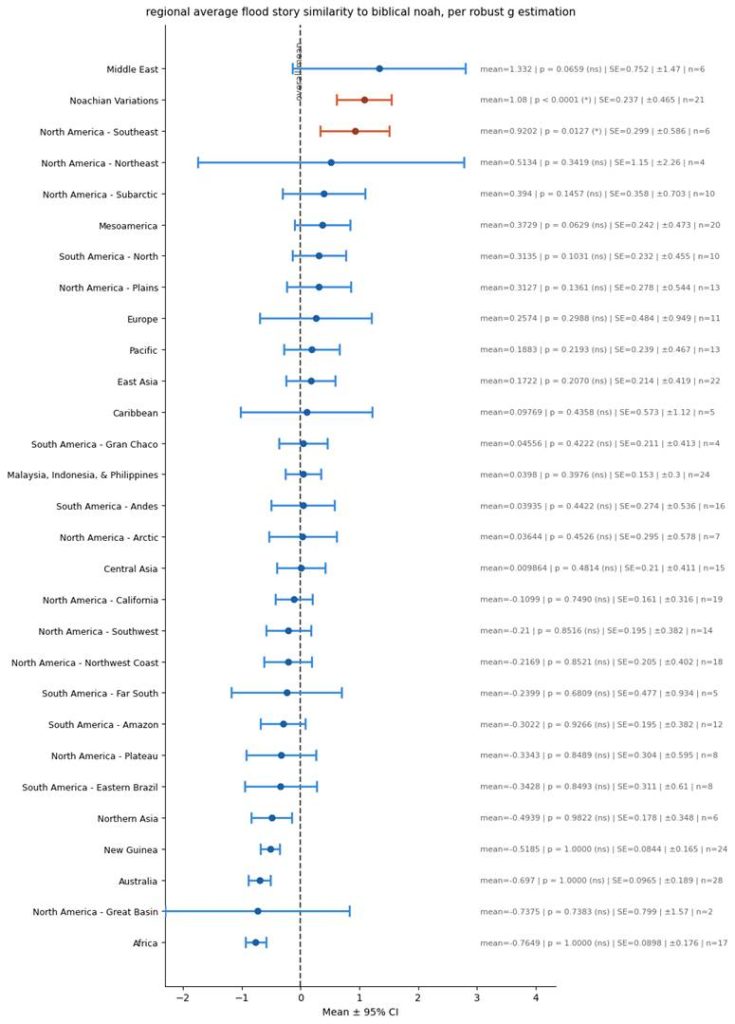
Thus, telling the robust Eigenvector estimator to seek the 80th percentile, here are my results across regions:
Comparing the different estimators:
To figure out whether my Eigenvector based evaluations are actually any good, and to compare the different estimations I have tried here, I created the following chart. Basically, this chart depicts how much variance in the estimation comes from each specific column. For any statisticians reading, this was computed by getting the variance of each column when it is multiplied by its associated coefficient found when regressing the candidate column estimating a story’s similarity score on all the 49 base columns – and then at the end normalizing by dividing each variance by the sum of all the variances.
For values that are green, that means that the associated column caused the similarity score estimator to get higher. And for values that are red, that means that the associated column caused the estimator to get lower. And to note, the last column “noahHatVariance” is for my second estimator discussed in the section “Regressing the LLM’s Similarity Score on all columns to create a Predicted Similarity Score” – which is functionally the same as the LLM rated similarity score, since that is just from a regression based on the LLM rated similarity score.
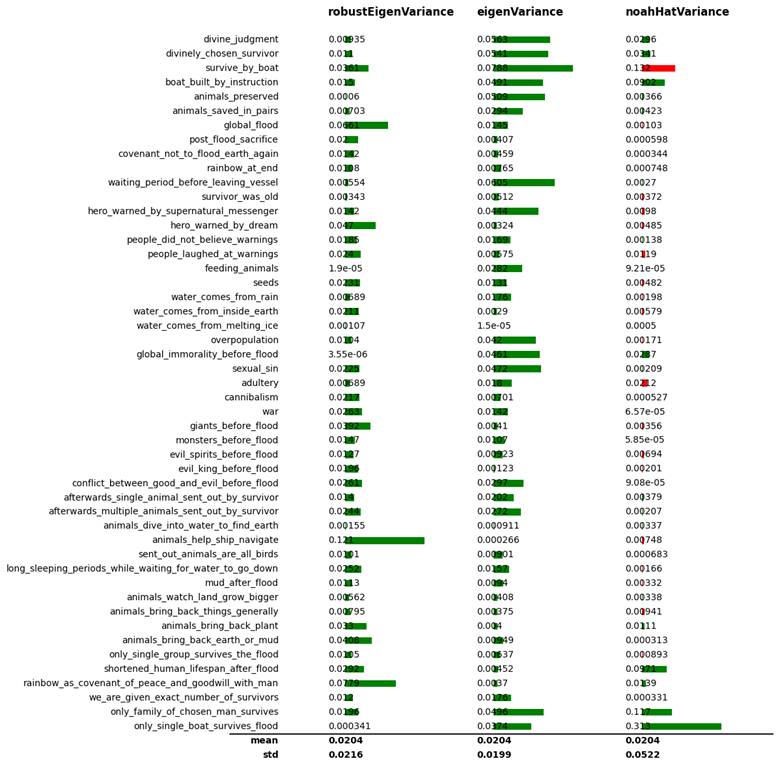
This graph is very important in demonstrating that my Eigenvector based estimators actually worked as intended:
Specifically, since all of these 49 columns logically and intuitively should positively correlate with a story being more similar to the biblical account of the flood, then if my eigenvector based estimations were actually any good, then it would only be positively correlated with the columns and not negatively correlated with them. And that is the case – as you can see, all of the values for these eigenvector columns are either green or zero.
How can I emphasize this enough: if there was not a common factor explaining all 49 columns about the flood, or if there was a common factor, but that common factor didn’t have anything to do with how similar a story is to the Biblical account, then I would expect about half of the columns for the Eigenvector based approximations to be negative (and so red). This is because the estimators here try to maximize correlation squared, not just correlation, so they don’t really care if the correlation is positive or negative. If there was a common factor, but it was only partially tied to the Bible, I would expect that at least a few of these values would be significantly negative (which is not the case). The fact that the values from these are all either positive or zero allows us to be completely certain that 1) this common factor explaining all 49 columns actually does exist, and 2) stories with the highest values in this common factor are actually the ones closest to the biblical story.
Indeed, for my Eigenvector based approximation, the story with the highest common factor score is in fact the Hebrew flood story from the Bible. Funnily enough, this is actually better than the estimator where I used a regression on the similarity score given by the LLM (which is in the third column). For that one, the Jewish account was instead in third place [regarding the robust Eigenvector estimation, the Jewish account was also in third place, and interestingly this estimator rated the Greek flood story as being closest to the elusive common factor].
This graph also confirms my suspicion that the LLM estimation of similarity of stories to the Biblical account was shallow. As one can see in the right chart, it appears that the main factors predictive of the LLM saying a story is similar to the Bible are: a) divine judgement, b) divinely chosen survivor, c) divine instruction on how to build the boat, and d) only one boat survived. As a side note: I think it rated the factor “survive_by_boat” so negatively because that was outbalanced by the factor “only_single_boat_survives_flood”; if “only_single_boat_survives_flood” is false, but “survive_by_boat” is true, that means that actually multiple boats survived the flood – which the LLM thinks is really bad.
While these metrics should matter, the LLM missed out on a lot of other important factors – such as for example the survivor sending out animals and the animals bringing back things, or the rainbow, or the survivor being old, among other factors which I will discuss in this next section.
Other Relevant Factors
To figure out why certain regions had higher similarities than others, I also looked at regional variation among a few relevant subfactors.
Animal Stories
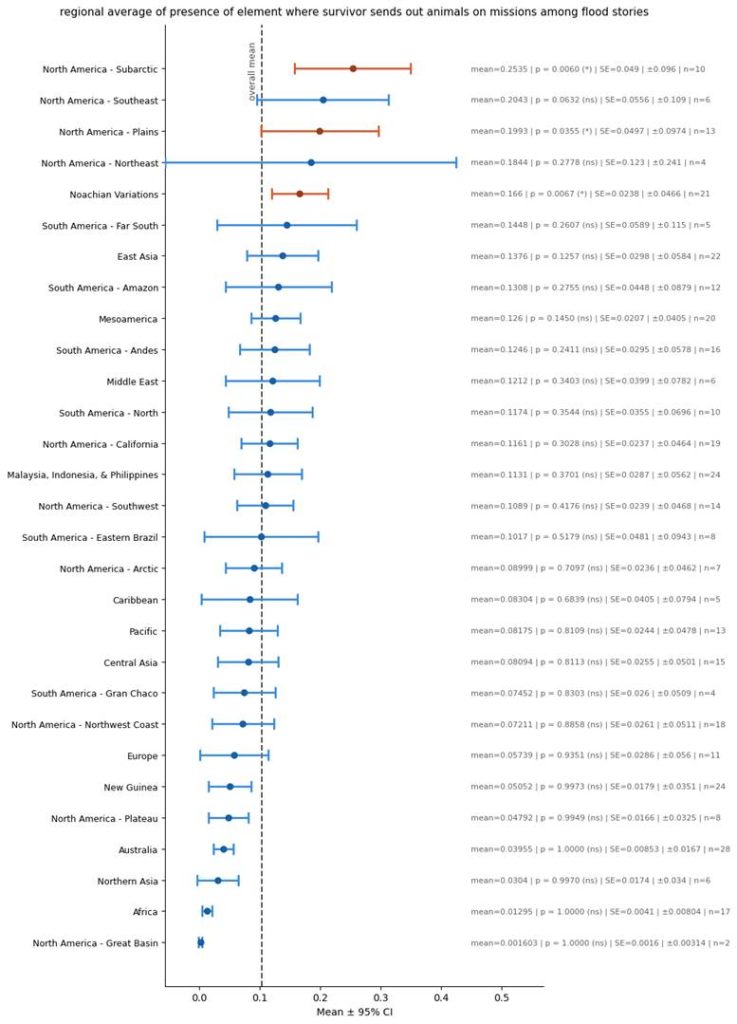
In my view, one of the most interesting similarities between the Biblical flood story and various tribal stories is the use of the animals:
In these American Indian tribe stories, very frequently we see the theme were the survivor, while on his boat waiting for the flood to subside, sends out animals to inspect the earth. Usually, he sends out around three animals, with the first two failing to find what he wanted, while the third succeeded – just like how the first two birds Noah sent out came back, while the last one bird never came back, telling him that he could disembark.
Essentially, these stories are similar enough to the Bible that it really seems like these stories must have evolved from a common source as the Bible. Yet these stories are sufficiently different from the Bible that it is obvious that the natives aren’t just copying the Bible stories – often times in these stories, the animals sent out are doing slightly different things from the Bible, such as trying to find pieces of earth or mud to give the survivor, or these animals might be mammals and birds diving down into the water rather than strictly flying birds.
To assess which regions had themes of the survivor sending out animals to scout the earth, I created a single metric for “sending out animals”, which was based on summing all of the below columns and multiplying them by their weights:
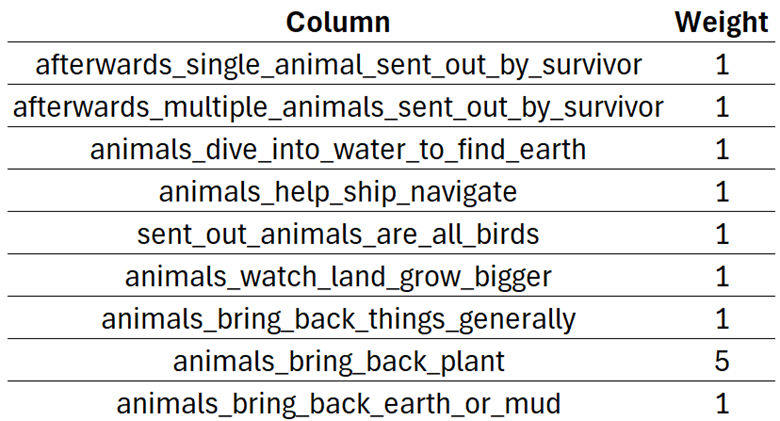
* Animals bring back plant has the highest weight because that is specifically what we see in the Bible.
So here is the regional variation in this sending out of animals by survivor factor:
Vulture Stories
The next interesting thing to see in stories is the presence of the following story:
- The survivor sends out a bird to inspect the world.
- The bird eats rotting flesh instead of reporting back to the survivor.
- God curses that bird to forever become a vulture for its disobedience.
This story is interesting because I have found it to be very common, despite its absence from the Bible. To create a vulture score metric for this, I evenly weighted and summed the following columns:

So here is the regional variation in that story:
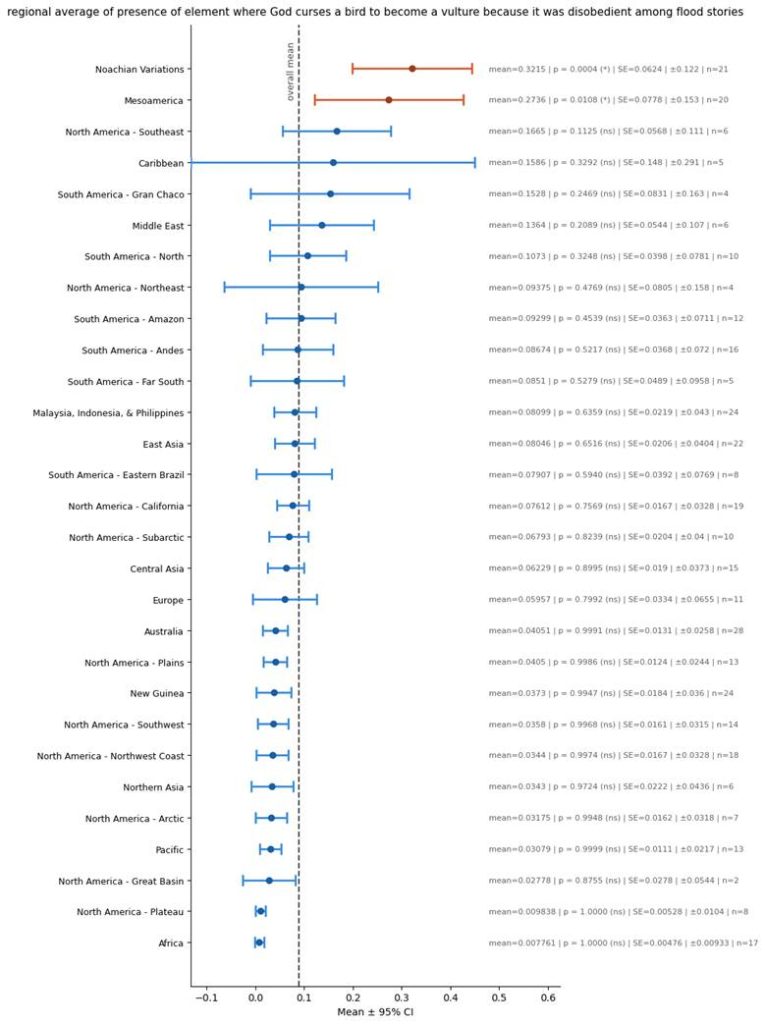
As you can see, this variant is extremely common in apocryphal flood stories (in the Noachian Variants). And this story is also present in the Americas.
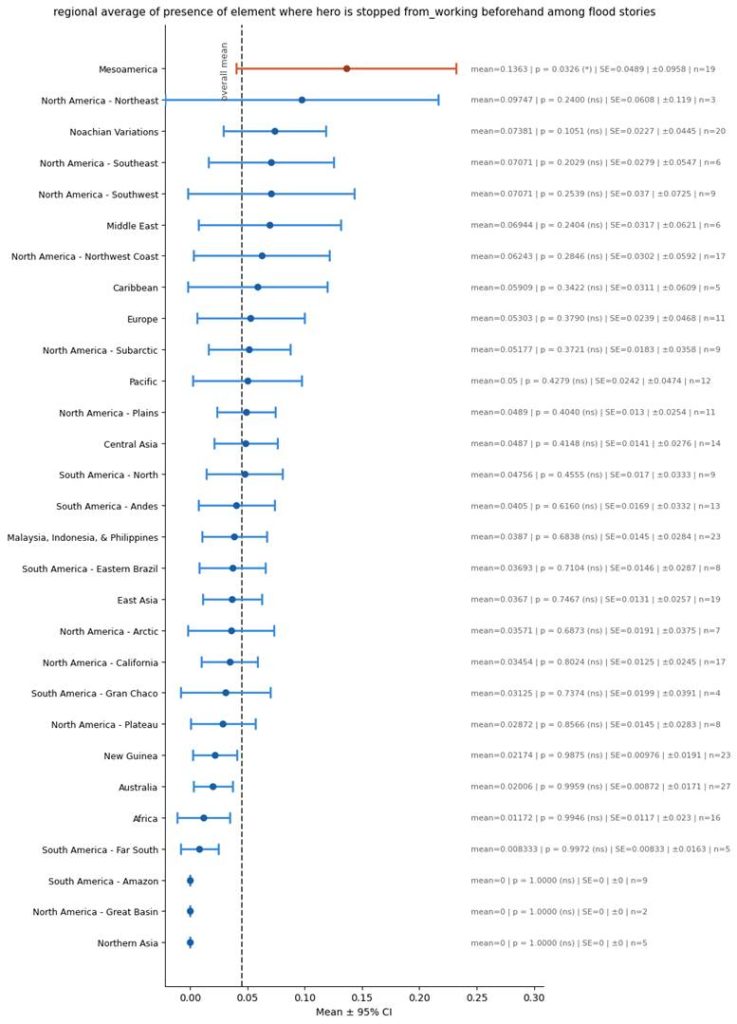
Prevented from Working Stories
Another feature I often see in flood stories is that of a divine messenger or miraculous events preventing the hero survivor from working, so that he can instead divert his attention towards preparing for the flood. Yet in our modern day Bible that feature is absent.
I only had one column measuring that feature – hero_stopped_from_working_beforehand.
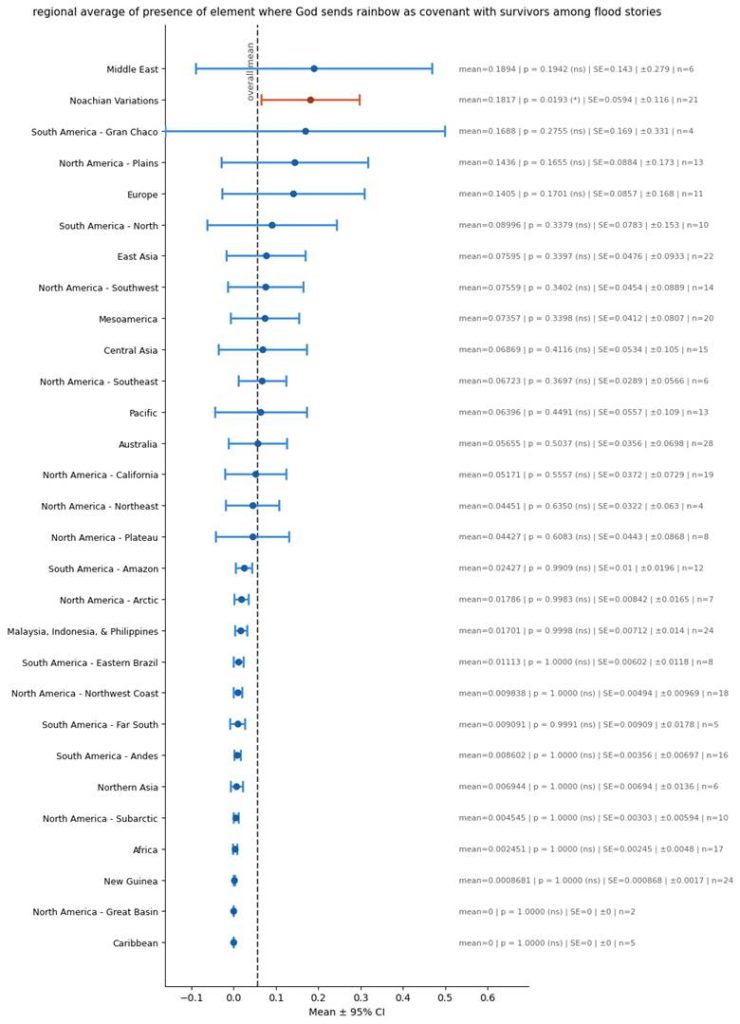
Rainbow Stories
Another specific element of the flood story that I evaluated was how God sends a rainbow as a covenant with the people after the flood.
I evaluated the presence of this feature by evenly summing the following two columns: rainbow_at_end and rainbow_as_covenant_of_peace_and_goodwill_with_man.
Here is the regional variance:
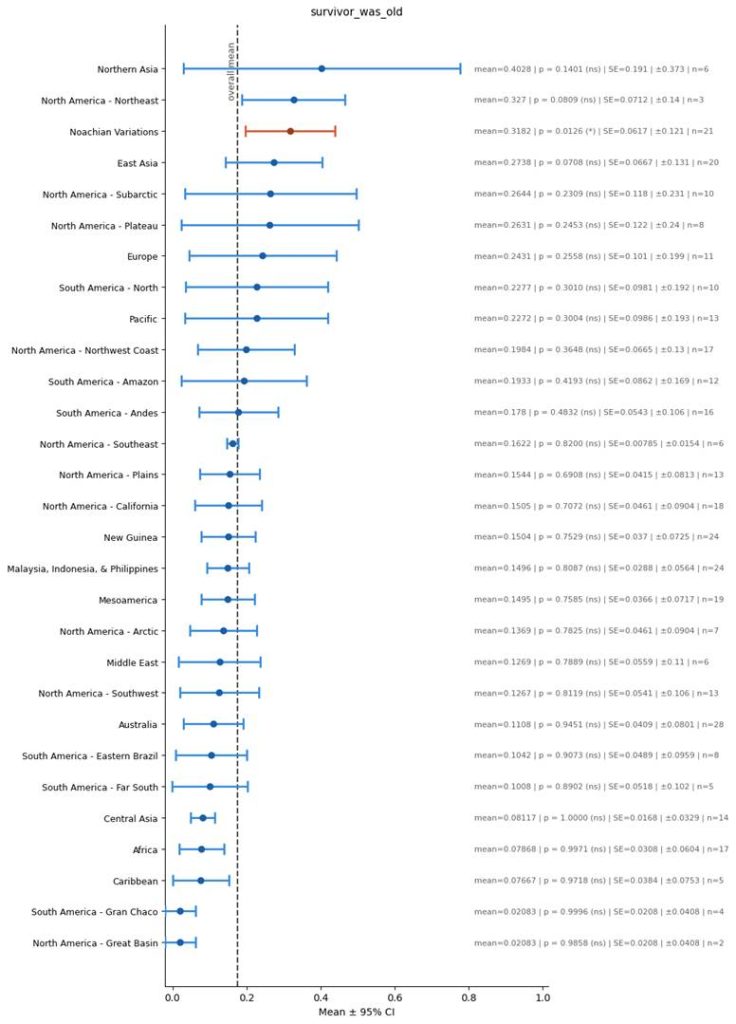
Survivor was Old
Here is a plot for the presence this feature:
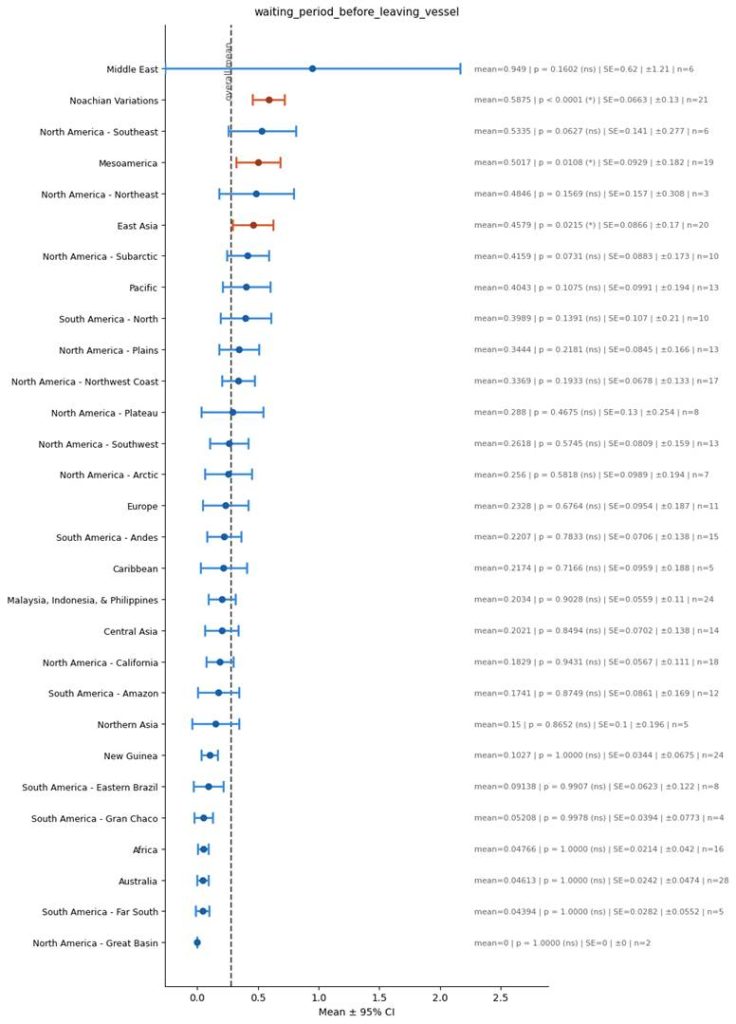
Waiting Period before Disembarking
Another relevant plot:
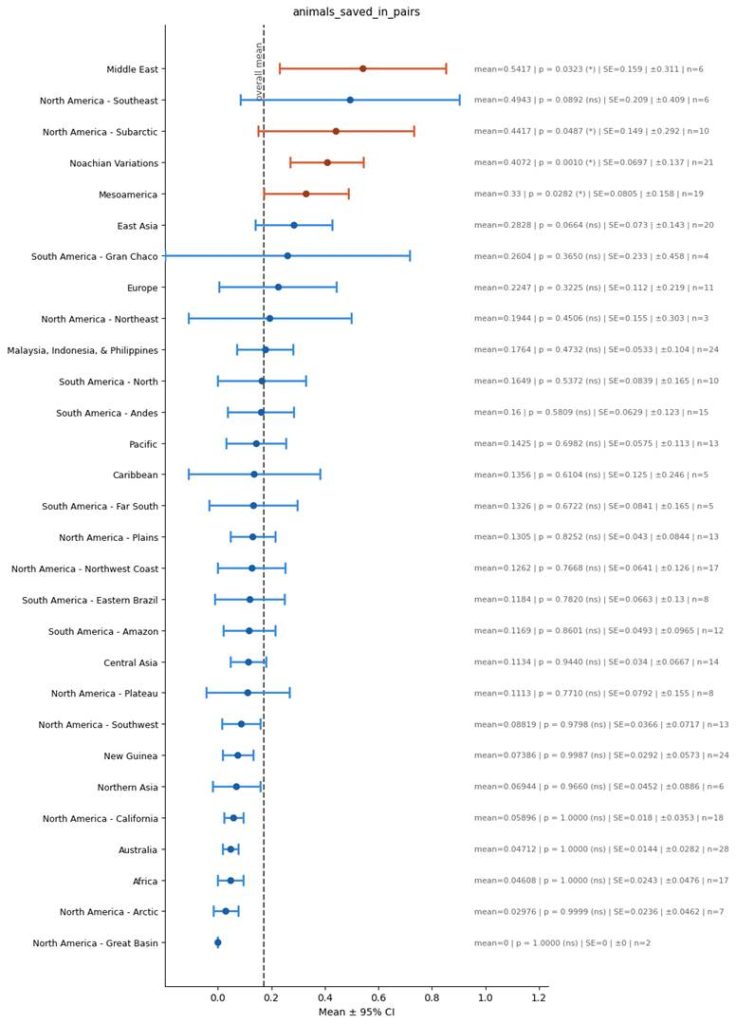
Animals preserved in Pairs
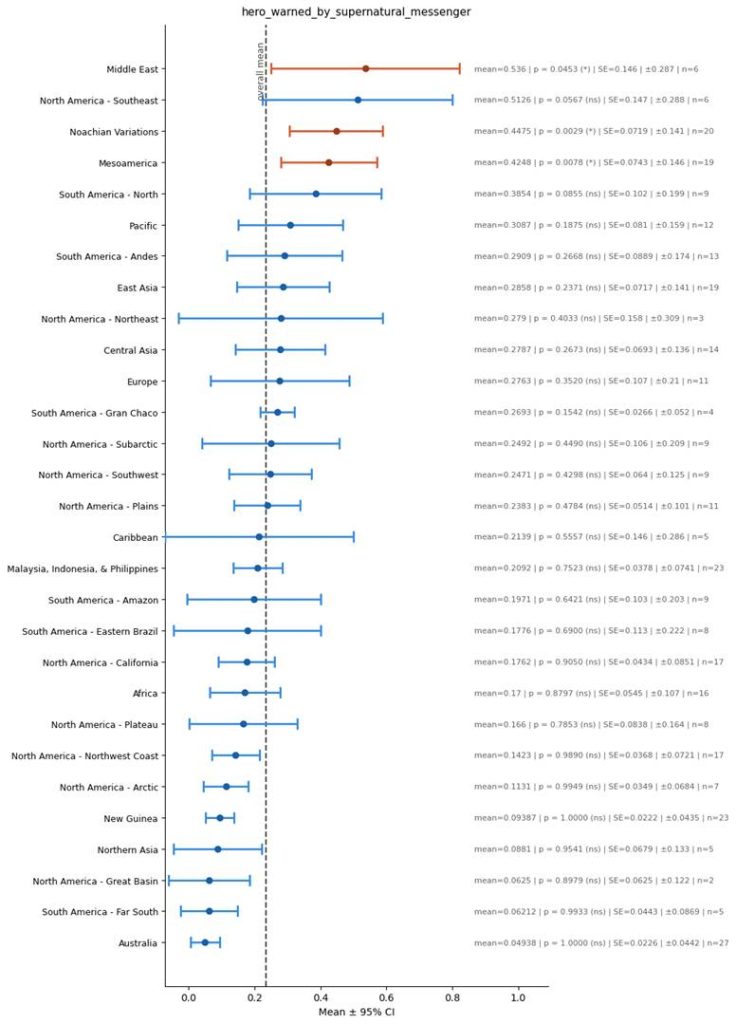
Hero Warned by Supernatural Messenger
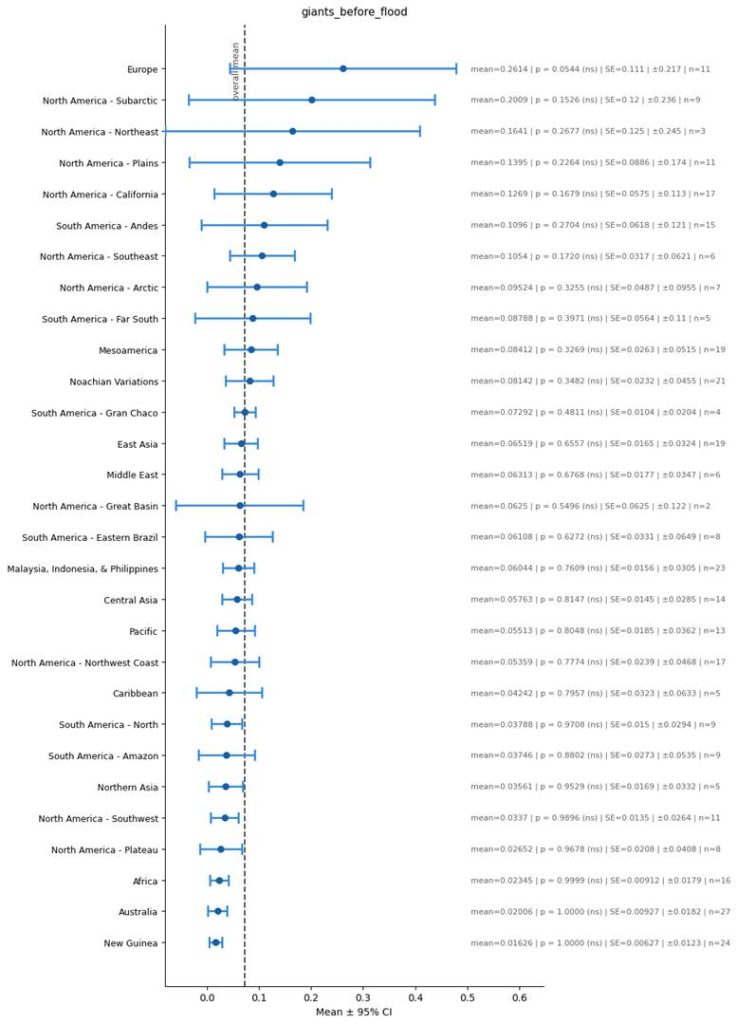
Giants before the flood
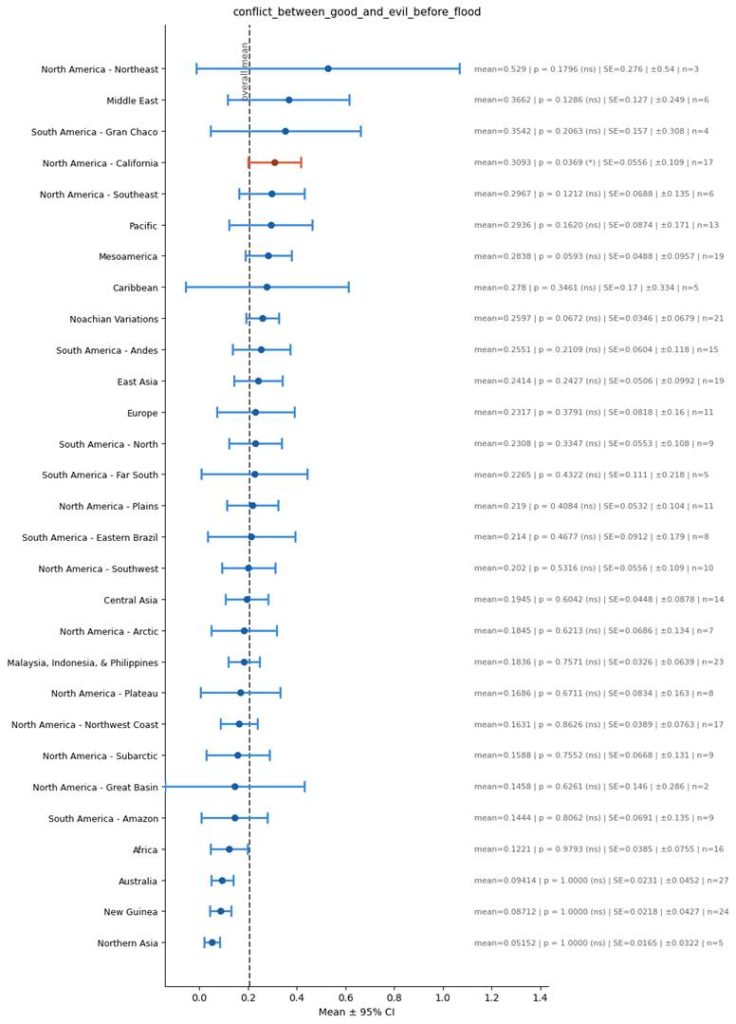
Conflict between Good and Evil before Flood
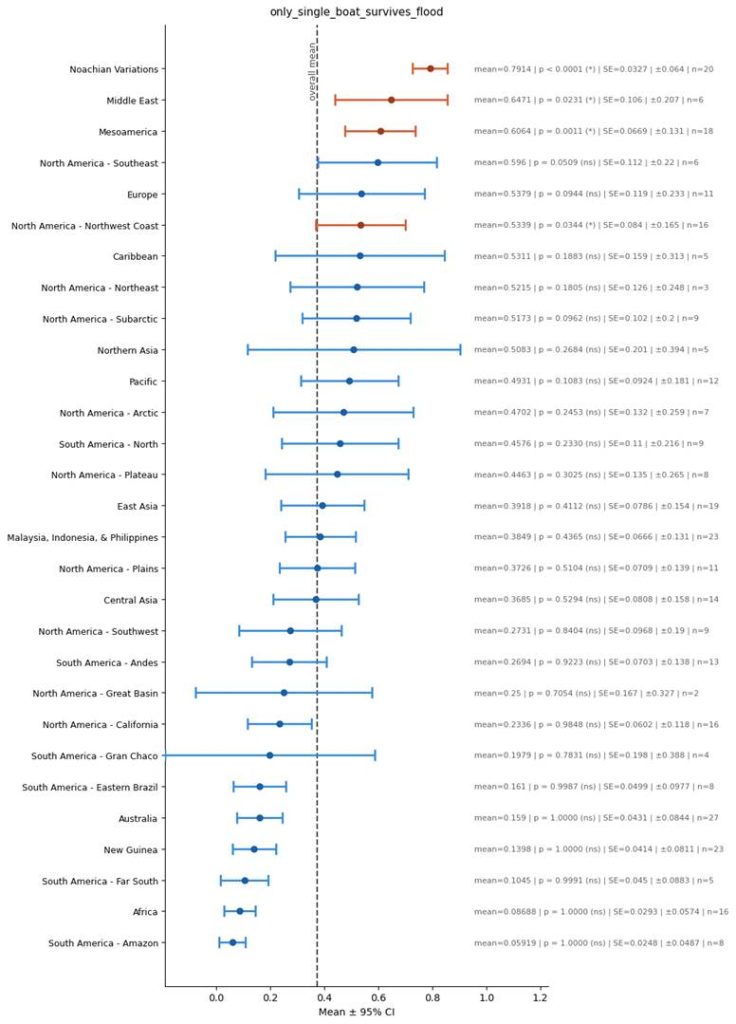
Only Single Boat Survives Flood
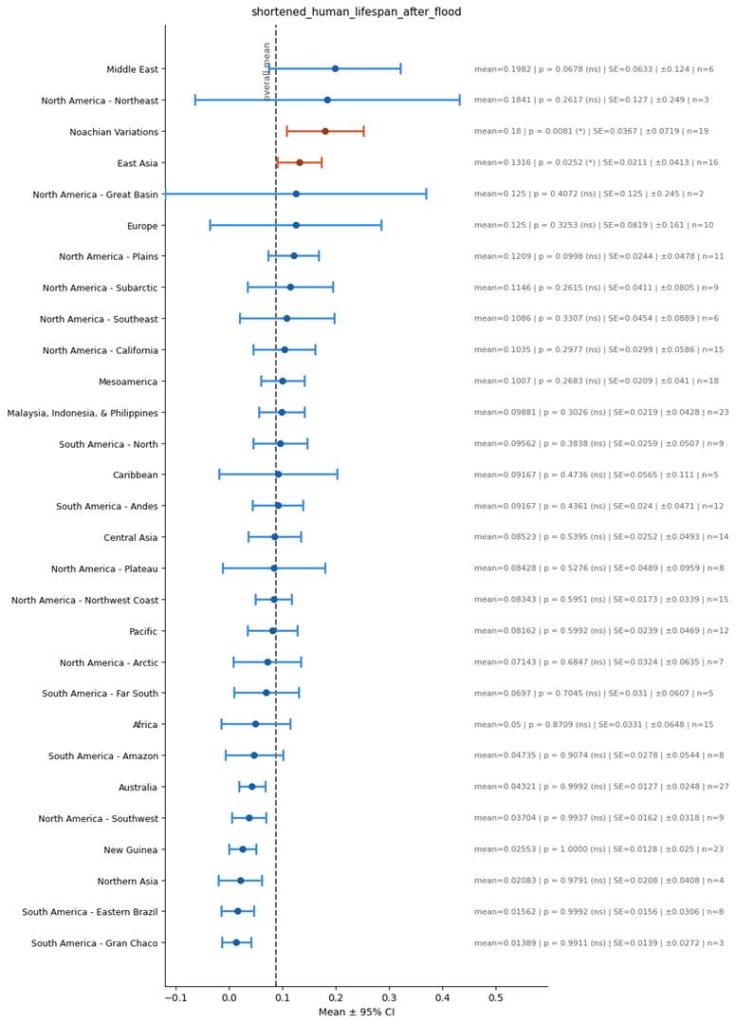
Shortened Human Lifespan After Flood
The Boat was Built by Instruction
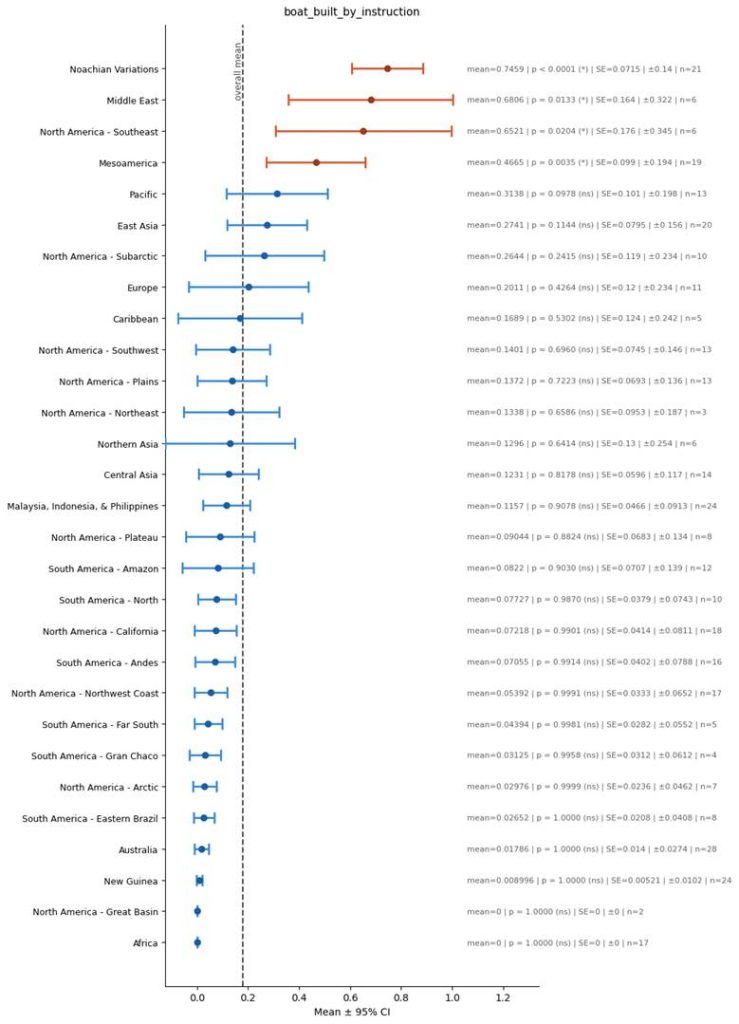
Conclusions
Regarding all Christianity
While the secular world recognizes that flood stories appear across many cultures, most people dismiss this as evidence of a real global flood. Instead, they argue that the story’s symbolic appeal led different cultures to develop similar myths independently.
Yet this is not true: if you take a look at my graphs, you will see that Africa, Australia, New Guinea, and Brazil all have vastly and statistically significantly different flood stories to those found in Europe, Asia, and North America. This means that the flood story of the Bible, with all of its specific details, doesn’t exist everywhere because of any sort of “universal appeal”, because if that were the case then it would also exist in regions like Africa.
To go deeper, flood stories in Eurasia aren’t mutually similar because they simply have the really basic idea of a guy surviving on a boat during a flood – which is such a simple archetype that you can sort of imagine it independently arising across different cultures. Rather, they are similar to each other because of much more specific features, which are harder to imagine would have independently arisen across cultures. Here are said features that I have shown in the above graphs:
- The sending out of birds to scout out the earth while the survivor is still on his boat waiting for the flood to subside.
- One of the birds which was sent out was disobedient and ate dead meat instead of reporting back. Accordingly, God cursed it and its descendants to become vultures.
- God sending out a rainbow as a covenant of peace and goodwill with the people after the flood.
- The survivor was divinely stopped from working before the flood so that he can prepare.
- The long waiting period before disembarking the boat.
- The survivor was old.
- Animals were preserved in pairs.
- Hero Warned by Supernatural Messenger.
- Giants before the flood.
- Only single boat survives flood.
- Shortened human lifespan after flood.
- The boat was built by instruction.
To note: the second and fourth factor of course are not present in the Bible. Since these factors are so pervasive across flood accounts that are not from Africa, to me it seems likely that these were in the original flood myth, but over the course of time the specific flood account we have from the Bible lost these details.
To generalize, here I have shown that there are certain features of the universal flood story which are not present in the biblical account, yet almost certainly were present in the proto-Biblical flood story, given their cross-cultural presence. This is very important because it proves that the universality of northern-hemisphere flood stories is NOT FROM CHRISTIAN MISSIONARIES, but rather due to a proto-Biblical-flood story from which north American, Asian, Middle Eastern, and European flood stories all descend.
As before, all of these specific elements are also basically never present in Africa, Brazil, Australia, and New Guinea. And the difference in rate of these specific elements occurring in these southern hemisphere regions when compared to that of Eurasia and North America is again very statistically significant. To emphasize, if this were all explained by natural human psychological inclinations, you would expect to see these specific elements prevalent in the Northern Hemisphere to also be present in these southern hemisphere regions – but that is not the case. Which is all to say that the patterns in similarities and differences among flood stories across geographical regions highly implies that flood stories in the Northern Hemisphere evolved from a common proto-Bible flood story – they didn’t arise independently from each other – while flood stories in the Southern Hemisphere did not descend from this proto Bible Flood story.
Who are the New Guineans, Aborigines, Africans, and Brazilian Tribes?
The most simplistic explanation for why flood myths from Africans, Australia, New Guinea, and Brazilian tribes do not resemble the story of Noah’s Ark is that these people literally were not descended from Noah (whereas most people from the northern Hemisphere are literally descended from Noah).
This perspective is somewhat validated by genetics studies – which finds Native Americans, Europeans, and Asians all to be far more genetically similar to each other than they are to Africans:
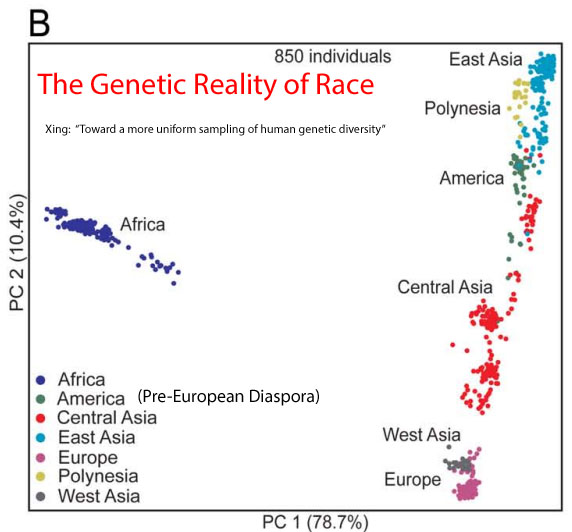
* Also, if you look at various maps of abuse, crime, and intelligence, it becomes even further apparent that these two groups – white and black – are fundamentally not the same people. See World Maps for more details.
Here is one interesting scripture that sort of validates the claim that these southern hemisphere peoples are not descended from Noah:
Moses 7:49-52
49 And when Enoch heard the earth mourn, he wept, and cried unto the Lord, saying: O Lord, wilt thou not have compassion upon the earth? Wilt thou not bless the children of Noah?
50 And it came to pass that Enoch continued his cry unto the Lord, saying: I ask thee, O Lord, in the name of thine Only Begotten, even Jesus Christ, that thou wilt have mercy upon Noah and his seed, that the earth might never more be covered by the floods.
51 And the Lord could not withhold; and he covenanted with Enoch, and sware unto him with an oath, that he would stay the floods; that he would call upon the children of Noah;
52 And he sent forth an unalterable decree, that a remnant of his seed should always be found among all nations, while the earth should stand;
Of course, it doesn’t really make sense to say that a remnant of Noah’s seed will always be found among the nations if all people are universally descended from Noah. Funnily enough, I am not aware of anyone who has reached this same conclusion as me from the scripture. Nevertheless, to me this scripture really only makes sense if you believe that many people among the nations are not Noah’s descendants.
Book of Mormon
As you can read in my essay, The Actual Location of the Nephites, my thesis is that the two main groups of peoples in the Book of Mormon – the Nephites and the Lamanites – were in the eastern United States, with the Nephites in the north-east, and the Lamanites in the south-east. Since the Nephites all die at the end of the Book of Mormon, while the Lamanites survive, it makes perfect sense that the area in the world with the most similar flood stories to the Bible – beyond the middle east itself – is south-east North America. The next two most similar areas to the Bible are usually 1) Meso-America, and 2) North-East North America – both of which are places which would have been adjacent to South-East North America and are places where the Lamanites and Nephites likely lived.
In my view, the similarities between the south-east USA flood stories are so compelling that even if the Book of Mormon were made up, it still would most likely be true that Jews anciently lived in the south-east USA, thus explaining why Jewish stories are preserved by Native American myth in the region.
People of course will try to claim that these similarities are primarily due to missionary work. But that is false, due to the following reasons:
- As previously noted, Southeast North America also contains legends which probably were in the proto-Biblical Noah account but now are lost in the modern Bible translation – namely, that of the hero being stopped from working, and the disobedient being turned into a vulture.
- Stories influenced by missionaries were already filtered out to the Noachian Variations section of this analysis or altogether excluded.
- This doesn’t explain why other regions of the world which also had missionaries are not at all similar – especially considering that missionary work in the United States was much more limited in scale compared to missionary work done elsewhere in the colonial world [for example, at the present time, only around 60% of Native Americans in the USA are Christian, of which number is far lower than what is seen in Latin America – for example, 95% of people in Peru are Christian].
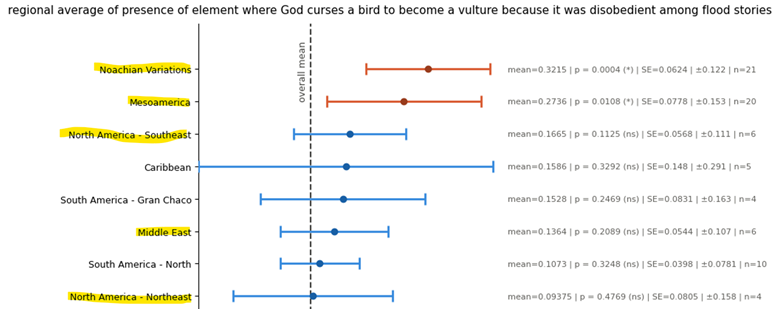
For convenience here are snippets of the charts showing that regions in the eastern USA have these two elements missing from the Bible – despite those elements being very common in Noachian Variations and also the Middle East.
Firstly, here is the plot for the story of the disobedient bird being turned into a vulture. Here I show only the top 8 regions, out of a total of 29 regions:
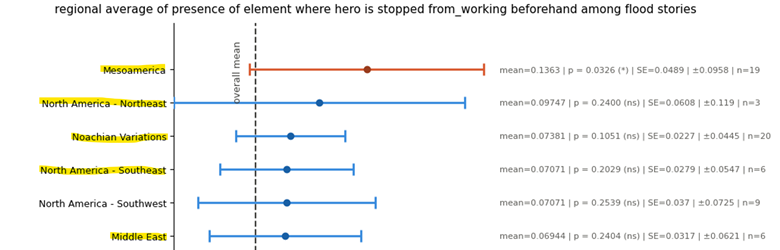
And here are the very top regions where the hero is stopped from working before the flood so that he can prepare:
Final Conclusions
I believe there was an original flood story, and that all peoples from Europe, Asia, and North America have flood stories that have evolved from this myth. Therefore, if one analyzed the multitude of flood stories preserved by Eurasian/Native American cultures, whatever are the common elements frequently seen in these stories are probably actually things that happened during the flood. Since the flood stories from Africa, New Guinea, Australia, and the Amazon do not appear to have descended from this same original story, then if these stories also have common elements with the Eurasian/North American flood stories, then said common elements probably are there just because of natural human psychology. Thus, to truly discover the original flood story, you really want to identify the common factors that are pervasive in the northern hemisphere, but basically never exist in the southern hemisphere.
In a sense, this is all very similar to how people are able to reconstruct the proto-Indo-European language. While we do not really have any physical proof that Indo-European – as a single language – ever existed, we still can be extremely confident that in the distant past this common language really did exist, given the many common features among European languages which are not found in languages from, say, East Asia. And as people have been able to reconstruct the words and phonology of Proto Indo-European by looking at similarities across languages, in my belief the same is possible for reconstructing this original flood story by looking at cross-cultural similarities in such flood stories.
As the data shows, the story preserved in the Bible appears to indeed be the closest to this common flood story. However, even the Bible story I think has lost some elements – namely, the vulture origin story and the hero being stopped from working.
In light of all the above statistics, in my view the most respectable secular position is that: yes, flood stories from Eurasia and North America indeed did evolve from a single proto-flood story – instead of arising independently – but that doesn’t necessarily mean that said proto-flood story really happened. After all of this analysis, this opinion seems far more logical than to say that either A) flood stories evolved independently but look similar due to human psychology, or B) that flood stories only look similar because they have been corrupted by Christian Missionaries. These two points about psychology and missionaries I have already extensively refuted, and if you don’t recognize that, then I doubt any statistics will be able to turn you away from your pre-conceived beliefs.
Even this more respectable secular position has problems though:
- This belief requires you to think that Asians brought the flood story with them across the Bering Land Bridge to America. Yet the last major movement across the Bering Land Bridge is said to have occurred 20 to 25 thousand years ago, which is a seriously long time for the story to survive.
- Moreover, the secular perspective is that the lineage of Europeans diverged from Asians 40 to 50 thousand years ago. That is a seriously long time for a common story to survive.
- This belief doesn’t explain why natives in Brazil and the Amazon didn’t also inherit this common flood story.
- This belief doesn’t explain the unusual concentration of the flood story specifically in South-East North America, while belief in the Book of Mormon does.
- It seems like a pretty big coincidence that the specific story with the highest common factor, according to the first principal component, is in fact the Hebrew flood story, out of a total of 368 specific places analyzed.
Hopefully all of this research has convinced you to have more faith in the Bible! Thanks for reading, have a great day, and may God bless you!
Finally, here is the code and data used to generate all of these statistics:
Leave a Reply